What are Core Web Vitals?
When building or scaling an online business, handling your website’s performance is one of the most crucial parts of the process.
Core Web Vitals are a set of performance metrics introduced by Google to measure user experience on a website, with a particular focus on loading speed, interactivity, and visual stability. These metrics are part of Google’s page experience signals and directly impact search rankings.
By handling these metrics and bringing them to the required level, you’ll drastically improve your website.
Our team conducted thorough research on over 20 websites. Based on this, we devised the best solutions to solve your website’s performance issues.
So let’s get started, and learn the core web vitals.
What are Core Web Vitals?

To clear the basic understanding, let’s first break down a few terminologies you will often come across throughout this guide.
Core Web Vitals: At the beginning of 2020, Google’s Chrome Team introduced a suite of quality signals or metrics that give you a clear idea of a website’s overall performance, called Core Web Vitals.
For instance, the human body requires daily check-ups or complete body testing if it is affected by the flu. In response, you run health tests to identify what’s wrong and what needs to be corrected.
Exactly, in the same vein, your website needs regular check-ups and testing to monitor its performance. One of the standard tests that Google recommends is the Google PageSpeed Insights (PSI) test, which provides detailed metrics and statistics, offering a comprehensive view of your website’s overall health and performance.
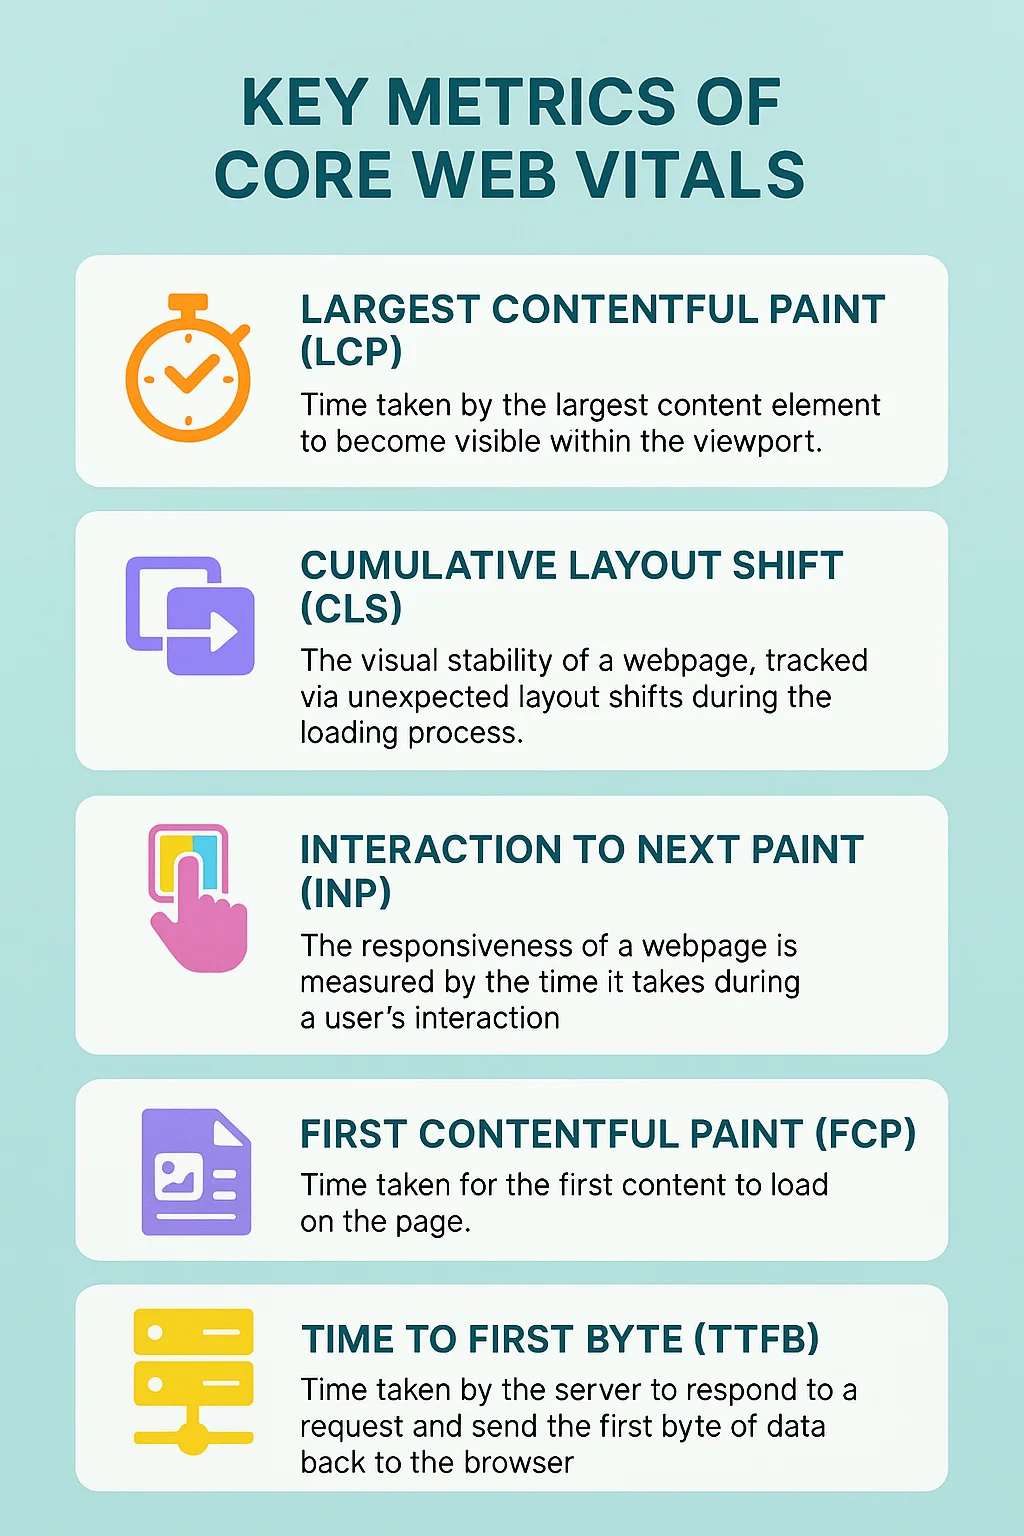
Overall, these metrics are collectively referred to as Core Web Vitals. The three critical metrics that fall under the core web vitals are Largest Contentful Paint (LCP), Interaction to Next Paint (INP), and Cumulative Layout Shift (CLS). Other notable metrics include First Contentful Paint (FCP) and Time to First Byte (TTFB).
How to Measure Core Web Vitals?
Now that you understand the terminology and key metrics related to core web vitals (CWV), let’s explore how to measure them.
As previously mentioned in the guide, core web vitals are metrics and stats you get upon running a Page Speed Insights (PSI) test. To check the CWV of a webpage, simply copy the page’s link.
Next, visit https://pagespeed.web.dev/.
Paste the copied link in the panel box and click analyze.
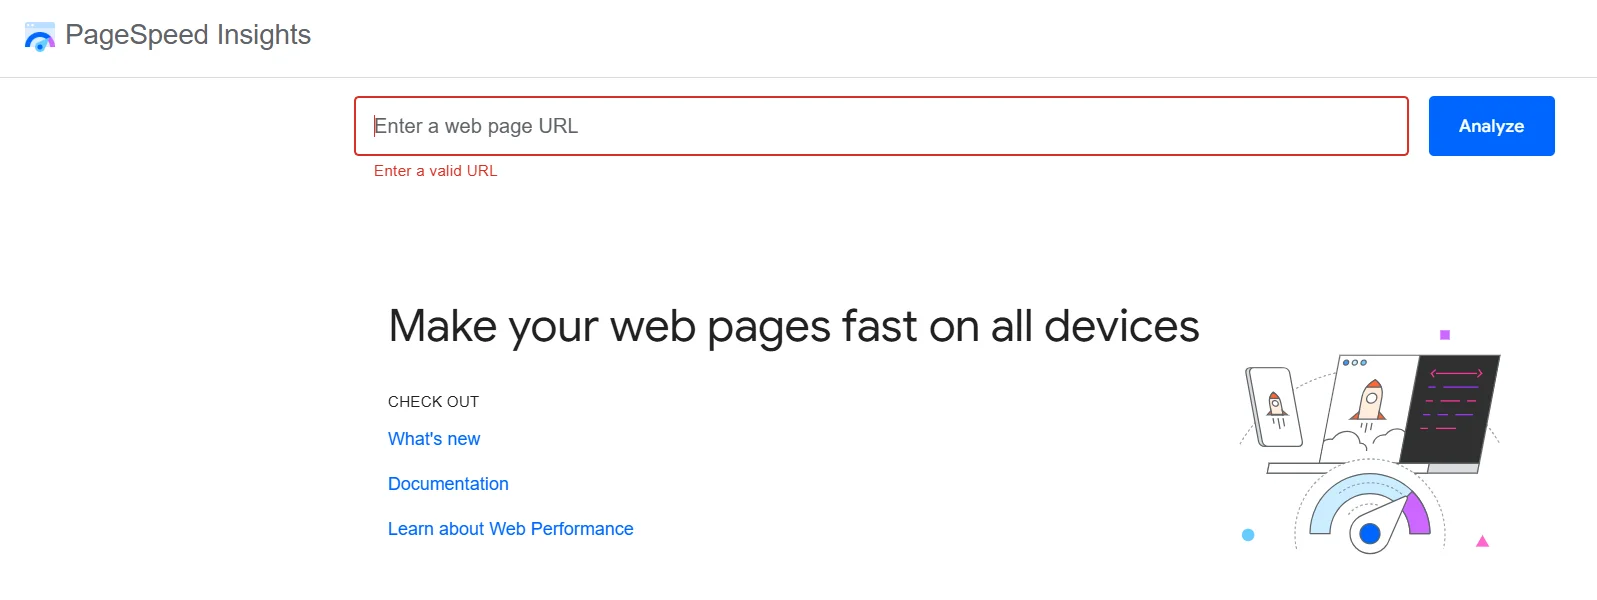
That’s it, in some time, you will get a detailed report of the web page’s core web vitals.
Alongside, you can also find a detailed report of your website’s core web vitals on the Google search console.
Key Metrics of Core Web Vitals?
When you run a PSI test, the report highlights key metrics, which are further classified into five broad metrics:
Here is a chart indicating a clear idea of what a good score is for each of these metrics:
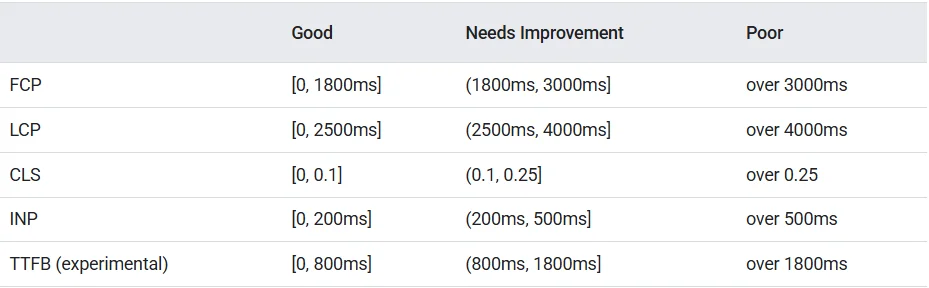
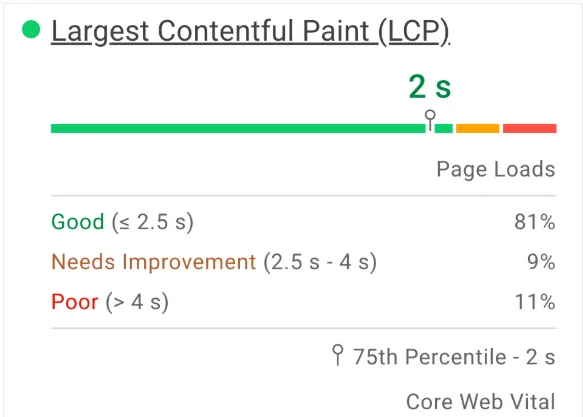
These Page Speed Insights (PSI) metrics display a distribution of this data, allowing developers to understand the variety of experiences for that page or origin. This distribution is categorized into three levels: good, needs improvement, and poor, denoted by green, amber, and red bars, respectively.
For example, 11% within LCP’s amber bar means that 11% of all recorded LCP values are between 2500ms and 4000ms.
Let’s now deep dive into each of these metrics. Alongside, while researching for the article, my team got in touch with various developers to understand how they work to optimize each of these metrics efficiently,
1. Largest Contentful Paint (LCP)
LCP measures how long it takes for the largest visible element on your page to load fully within the user’s viewport. This may include any media file, such as a hero image, a heading, a website banner, or a video.
This metric directly relates to how quickly users perceive your page as helpful. A page with high LCP takes a lot of time, hampering the user experience.
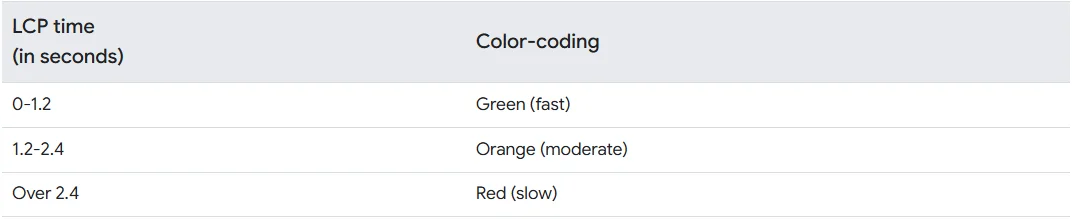
The following table, by Chrome developers, will give you a clear idea of the ideal LCP threshold for different devices.
For Mobiles:
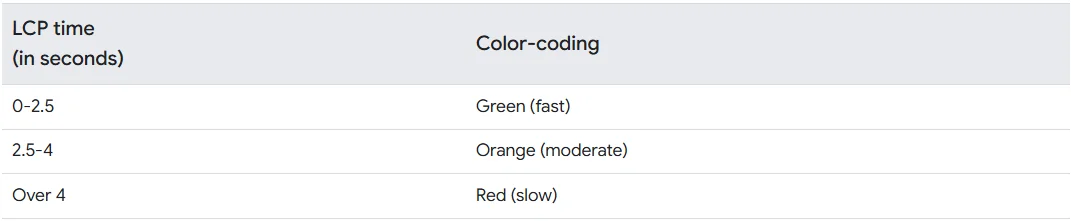
For Desktops
How To Improve LCP
Three major elements mainly contribute to the issues in the LCP:
- TTFB, caused mainly by the selection of hosting, CDN, and page caching
- Time taken and delay in the resource or media loading
- Delay caused by the rendering of the element
TTFB in itself is one of the crucial metrics impacting the overall CWV, which we have discussed separately in the article.
However, to address other LCP-related issues, focus on the loading time of critical resources, consider preloading essential images, and exclude above-the-fold media from lazy loading.
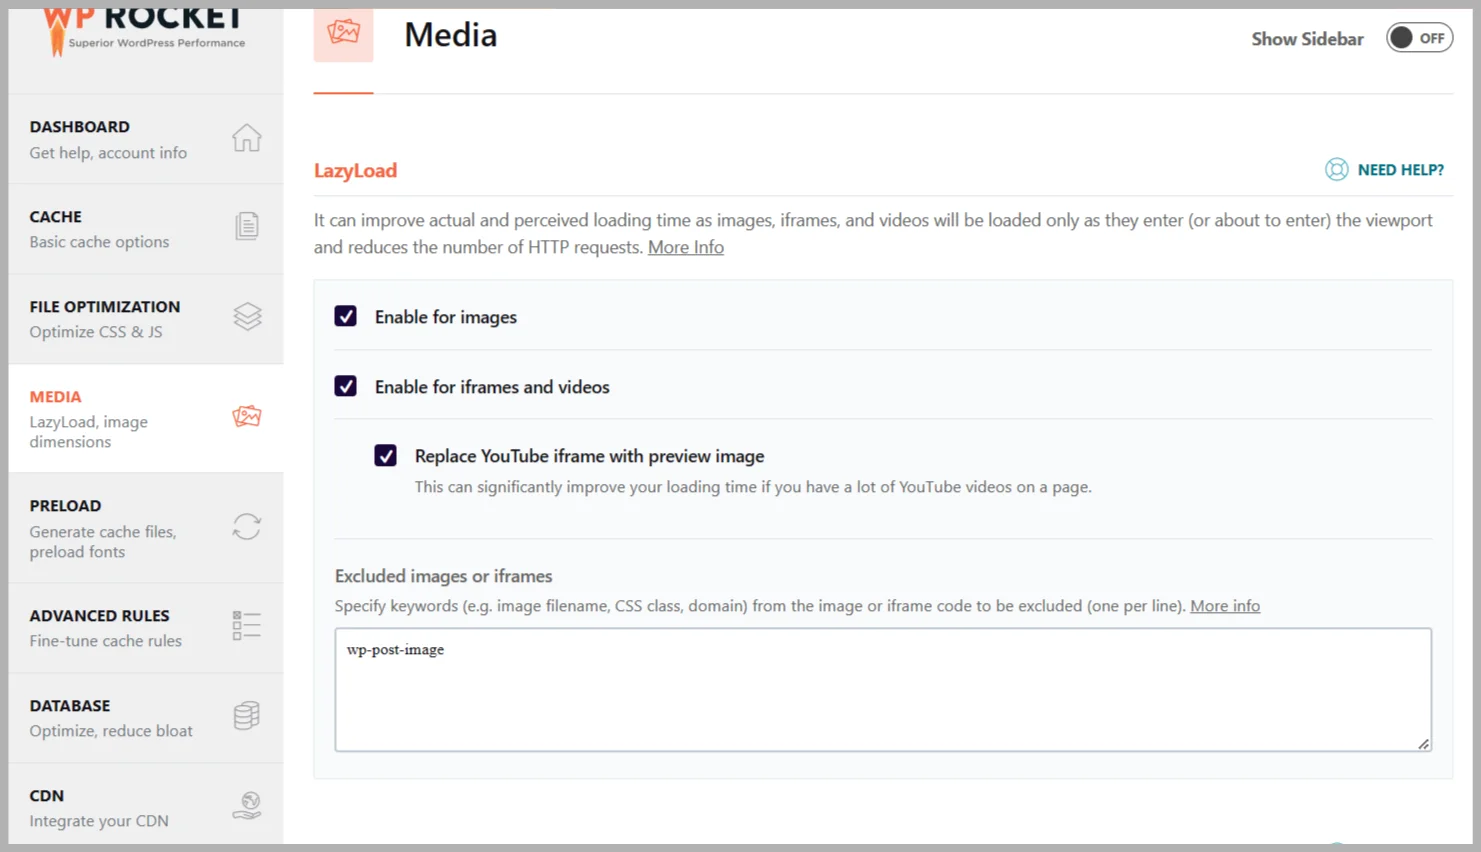
Additionally, you should optimize all images across your website in the WebP format, with relevant sizing for each device.
To reduce bloat on your website’s backend, minify and defer JavaScript and CSS files if you’re using a WordPress theme like Responsive Theme or Blocksy, and plugins that remove render-blocking resources can be the most effective options.
Furthermore, consider improving font loading by preloading key fonts and hosting them locally to enhance your site’s Largest Contentful Paint (LCP).
While you do not have to implement all of these remedies, consider those based on the issues raised in the PSI report.
2. Cumulative Layout Shift (CLS)
CLS tracks unexpected layout shifts that occur when a page loads.
To understand it more clearly, let’s consider the example of a user trying to click a button on the checkout page, but shifting away at the last second results in a click on the wrong button.
Irritating ain’t?
That’s exactly what the cumulative layout shift means: it quantifies how visually stable your page is while loading.
The above video demonstrates how a user can suffer because of CLS; herein, he wished to click “No, go back,” whereas due to the shift, the input went as “Yes, place my order.”
The layout instability of a page not only frustrates users but also creates a poor experience that search engines penalize. In contrast, a stable layout keeps your visitors engaged and encourages them to stay on your site longer.
How To Improve CLS
Unoptimized fonts, media, ads, and improper CSS handling are the primary causes of the issues highlighted under CLS issues.
The best way to reduce the cumulative layout shift (CLS) is to allocate a fixed-sized space for ads, pop-ups, and banners that change over time. Using tools such as Google’s Layout Shift Debugger can help you accurately spot moving items.
To address this, explicitly define the width and height of pictures, videos, iframes, and embeds. It is also advised to host fonts locally, preload them, and use them to prevent layout shifts brought on by FOIT or third-party font downloads.
Moreover, various LCP issues also overlap and occur in the CLS, for which you can consider implementing lazy loading or deferring JavaScript.
3. Interaction to Next Paint (INP)
INP is a recently introduced metric in PSI metrics. Earlier, the metric was measured in terms of FID (First Input Delay); however, after March 2024, it was replaced in Core Web Vitals with an enhanced metric of INP.

It measures a page’s responsiveness by tracking the delay between user interactions, i.e., the time between a click or keyboard input and the subsequent visible change on screen.
After providing the required input, it determines how long a user will have to wait to get the desired output. A high INP can be frustrating for users, especially on mobile devices.
How To Improve INP
First Input Delay (FID) is primarily contributed to by JavaScript-related delays caused by the website’s architecture, themes, page builders, or third-party code.
Optimizing the INP is considerably easier than other issues. You can easily do this by reducing the JavaScript delay, which follows a step-by-step procedure.
First, check for heavy Chrome DevTools scripts and delay or defer any unnecessary tasks. Next, remove any unnecessary JavaScript and CSS. If you are using a CMS, it is recommended that you avoid those that offer bloated themes or increase page size with additional page-building elements.
Other Notable CWV Metrics
There are two metrics that add additional value to your website performance.
1. First Contentful Paint (FCP)
FCP measures the load time of the first bit of content, such as text or images, that appears on the screen after a user navigates to your page.
It’s the first visual cue that your website is loading. When users see that something is happening on screen, they’re more likely to wait, reducing bounce rates and increasing engagement time. A delay here gives the impression of a blank or stalled site, especially for new visitors.
The following table, compiled by Chrome developers, provides a clear idea of the ideal FCP threshold for various devices.
For Mobiles:
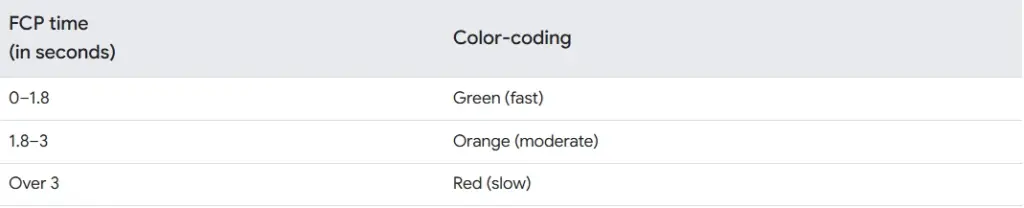
For Desktops
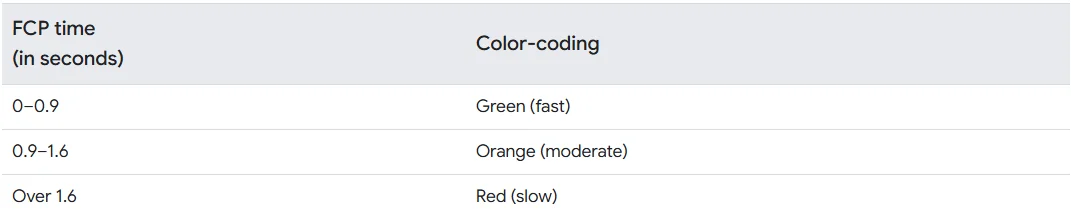
How To Improve FCP
As is clear from the definition itself, the primary aim of FCP, or First Contentful Paint, is to speed up the loading of the first visible content.
While working on LCP, CLS, and INP already help reduce most of the FCP issues, a few other general methods that additionally help include:
- Choosing a fast DNS provider and enabling full-page caching to deliver content quickly.
- Generating and inlining critical CSS to avoid Flash of Unstyled Content.
- Using multiple caching layers and setting a longer cache expiration time.
2. Time to First Byte (TTFB)
TTFB measures how long the user’s browser takes to receive the first byte of data from your server. It reflects the server speed and how efficiently your backend handles requests.
Slow TTFB is often a result of a poorly located or distant hosting server, heavy backend processing, or unoptimized databases.
How To Improve TTFB
The TTFB, or Time To First Byte, is primarily affected by the choice of your web hosting and CDN provider. Additionally, occasional issues with these may significantly impact the TTFB of a webpage.
If you are just starting with a new website or after a lot of efforts, issues related to this persist, the best solution is to change your hosting provider.
If you have little or no idea of how to choose hosting, consider reading our guide on beginners guide to web hosting.
However, if you think, based on the PSI report, the TTFB issues are still manageable, you can consider opting for solutions like:
- Using the load balancing features in existing CDNs improves latency and uptime and distributes traffic effectively.
- Enabling TLS 1.3 and HTTP/3 improves hosting security and reduces latency.
- Increasing cache TTL and using efficient cache tools.
- Optimizing databases and reducing server load through upgraded hosting plans
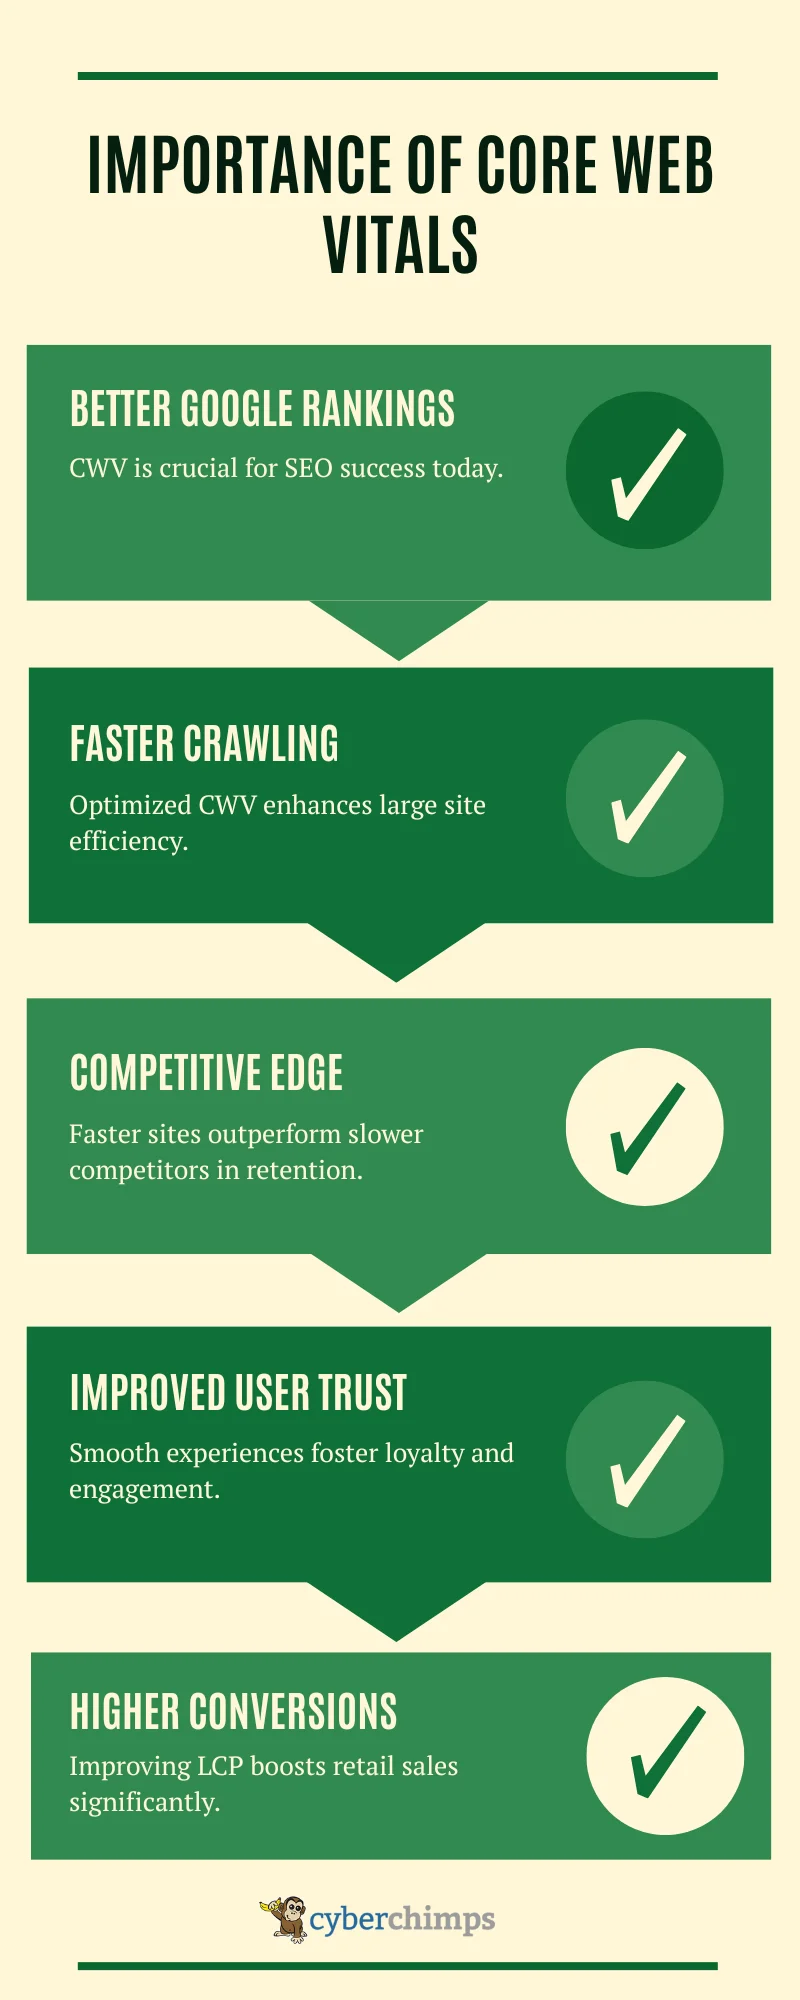
Why Optimize Core Web Vitals?
Following the techniques mentioned earlier can help you easily scale your website.
While working on the site’s CWV score primarily aims to enhance its performance, it is also of significant importance for other reasons.
FAQ
At the beginning of 2020, Google’s Chrome Team introduced a suite of quality signals or metrics that give you a clear idea of a website’s overall performance, called Core Web Vitals. The three critical metrics that fall under the core web vitals are Largest Contentful Paint (LCP), Interaction to Next Paint (INP), and Cumulative Layout Shift (CLS).
To check the CWV of a webpage, simply copy the page’s link. Next, visit https://pagespeed.web.dev/. Paste the copied link in the panel box and click analyze.
LCP measures how long it takes for the largest visible element on your page to load fully within the user’s viewport. This may include any media file, such as a hero image, a heading, a website banner, or a video.
CLS tracks unexpected layout shifts that occur when a page loads.
INP measures a page’s responsiveness by tracking the delay between user interactions, i.e, the time between a click or a keyboard input and the following visible change on screen.
To improve the core web vitals of a page, you can use either generic or issue-specific solutions. While a few issues have standard solutions, others require technical optimizations.
Conclusion
Optimizing a website with metrics highlighted under Core Web Vitals is by far the best way to scale your website’s performance.
While some of the issues highlighted are complex and challenging, this article outlines tried and tested methods to address them. Moreover, aligning your website with best practices for optimal performance will give your business a competitive edge.
Further, if you find this article valuable, also consider reading:
- What is WordPress Plugin – A Complete Guide for Beginners
- How to Optimize Your WordPress Site for Mobile Users
- 7 Best Ecommerce Website Builders – Detailed Review
Consider checking out the Cyberchimps Responsive Theme if you want to build a WordPress website.


